The Revenue metric! One of the most looked at and valued metrics in Digital Marketing!
Today we’re going to be taking a look at this metric and everything we can do with it.
According to Forbes, choosing your metrics and seeing how they can be analyzed is one of the most important parts of any business.
There’s already a lot of information about which metrics to choose for your marketing, not so much about how they can be analyzed and what you can do with them.
This is why one of our goals for this series (see our previous article on the “Spend” metric) is to streamline metrics in all platforms. Later we’ll talk about the amazing things we can do with holistic data and how they can help you solve your business problems.
Here’s what we’re going to be talking about today.
Table Of Contents
1. Definition Of The Revenue Metric
2. Revenue Metric & Its Place In Marketing Platforms (Facebook, Linkedin, Instagram & Google Adwords)
3. Aggregate (But Why?)
1. Definition Of The Revenue Metric
Revenue is one of the most important metrics for a reason. Because it’s one of the few metrics that focus on the bottom-line, marketers put it first.
According to Drift, focusing on the revenue metric is the right path to take.
“Formalizing more marketing KPIs distracts from the bigger goal of generating revenue. There’s lots of setting up dashboards, testing those data connections, and defining the KPI. But if you focus on revenue, you’ll automatically start asking questions about how to optimize your marketing for that outcome,” explains Sarah Siwak, Director of Marketing at Shyp.
Additionally, from revenue you can calculate other metrics as well.
“But if you focus on revenue, you’ll automatically start asking questions about how to optimize your marketing for that outcome” – Sarah Siwak, Director of Marketing at Shy
2. Revenue Metric & Its Place In Marketing Platforms (Facebook, Linkedin, Instagram & Google Adwords)
Facebook Ads
Facebook Ads typically report on clicks and leads, not on actual monetary amounts. However, it’s possible to add custom columns to Facebook Ads Manager to report on eCommerce purchases as well so you can see the actual monetary amount.
Here is what that would look like:

A more thorough overview can be found on Social Media Examiner.
Based on that, you can see the revenue amount on Facebook Ads Manager.
It’s also possible to monetize Facebook videos, Instant Articles and look at Facebook’s Audience Network through Facebook’s Monetization Manager. It would give you an estimated amount of how much you made based on views and clicks.

Tracking the revenue metric on Linkedin is a little different though, since it’s mainly used for B2B companies. Marketing automation and CRMs play a huge role in helping with the tracking.
Linkedin Ads
Linkedin can’t directly report on revenue, so it’s vital to have marketing automation and CRMs in place for tracking that (and you can connect that to Linkedin). Essentially, you would need to pull a revenue report.
Business For Linkedin says that CRMs have a couple metrics you can use to gauge revenue.
Reporting to explore in your CRM systems:
In Microsoft Dynamics
In Salesforce
In HubSpot
HubSpot, a LinkedIn Marketing Partner, offers their Ads Add-On product that tracks opportunities and revenue generated from LinkedIn Ads automatically.
Instagram Ads, on the other hand, are used by eCommerce companies and B2B companies. The app is mostly photo-based, so more eCommerce companies rely on it to sell their products.
Instagram Ads
Interestingly, Instagram was never made with advertising in mind, unlike Facebook. Ifluenz says that “With Instagram, it is not so straightforward. Instagram, unlike Facebook, was not built with marketing in mind and, as a result, it is harder to measure your advertising campaign’s success.
The good news is that Facebook – the company which owns Instagram – is taking proactive steps to make the app easier for digital marketing professionals to use. But, there are still plenty of metrics you can use to measure your ROI and produce some meaningful figures.”
So although you can’t directly measure your ROI from ads, a good tip is to use your URL as much as possible to track viewers back to your site. Using Google Analytics, you can then see how many people come from that platform and track eCommerce transactions from there.
 Source: Disruptive Advertising
Finally, we have Google Adwords. Even in Google Adwords, it’s not so straightforward to find revenue, since leads/conversions are the end metric. Digital marketers have come up with unique ways to get around this.
Google Adwords
Remember that conversions are the end goal in Google Adwords. Whether those conversions turn into actual money is something that can be figured out in a CRM such as Salesforce (like above with Linkedin Ads), or it’s something that can be measured in Google Analytics for eCommerce companies.
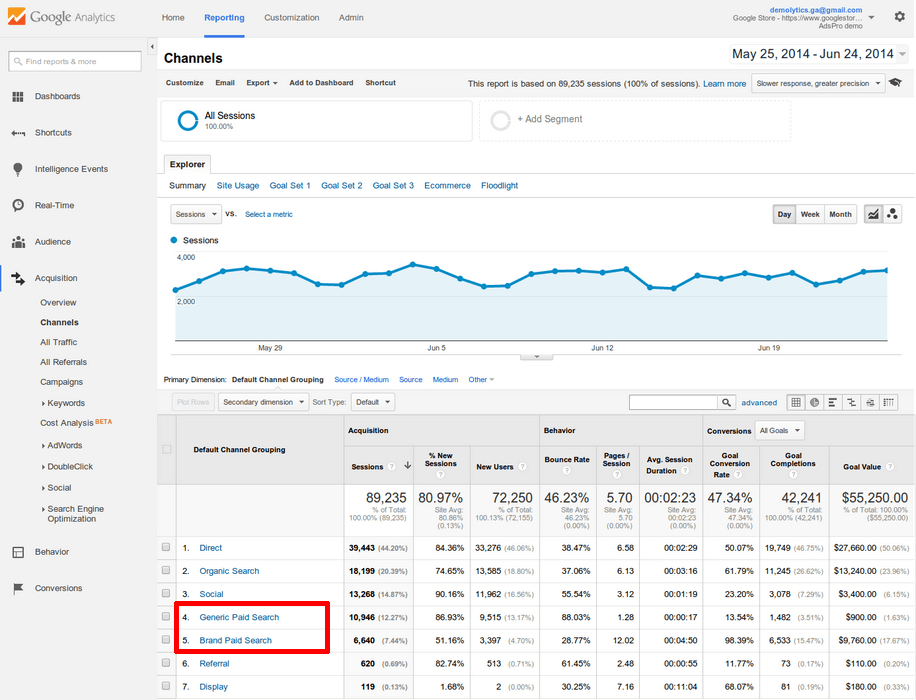
This can be done by taking a look at Google Adwords in Google Analytics. If you have enhanced eCommerce set up, it’s easy to see how much you gained from looking at Goals. You can even separate by brand and paid search.
 Source: Search Engine Land
We’ve seen different ways of figuring out revenue from ad platforms, and how hard it can be. But if you’re advertising for one campaign across all platforms, aggregating revenue becomes necessary. This is just one of the reasons aggregating revenue is especially important.
3. Aggregate (But Why?)
We’ve talked before about why aggregating the spend was important, but that was fairly easy to find across all ad platforms. But if revenue is not aggregated, then it can make it impossible to calculate profit of all marketing platforms, which is a key piece of data your CMO wants to know about.
Your data will also be holistic which will make it easy to understand in whatever visualization you choose to put it in. The good news is, once you use a marketing intelligence solution like PenPath, we’ll help you bring all data (like revenue) together + make sure it automatically refreshes.
Here are also some other reasons for aggregating data:
- Efficient Data Management
- Deeper Data Analysis (Able to create unique calculations once we have everything in one place)
- Better Data Quality (Because of Data Cleaning)
- Higher Understanding Of Data (It’s worked with regularly!)
In our next article, we’ll see the types of visualizations that can be made when all of this is together.
At PenPath, we specialize not only in creating custom dashboards for our clients, but also connecting, cleaning and securing their data.
We have experience working with a variety of social advertising platforms and are able to siphon data from most places before blending it.
If this sounds like something you might be interested in, book a demo with us. We’re also available if you need help doing any of the above.
Otherwise, look forward to Part 2 of this article, where we talk about the insights you’re able to uncover after getting these preliminary steps set up – and how they can help you solve your business problems.


