In this article, we will examine Tableau as a case study to understand the factors involved in bringing business intelligence operations in-house. We’ll explore the specific tasks and hurdles faced when setting up Tableau.
Tableau is a powerful tool used for visualizing data and improving business intelligence. It allows users to connect with various data sources like databases and cloud services, enabling them to create interactive and visually appealing dashboards, reports, and charts.
However, when delving into the setup process of Tableau, it becomes apparent that it involves complex tasks, especially in data fetching and cleaning. Without the guidance of experienced professionals, tackling these tasks could pose risks such as data integrity issues, slower performance, security vulnerabilities, and challenges in visualization design and integration. Due to Tableau’s intricate nature and the critical importance of data cleanliness, seeking the expertise of a specialist becomes crucial to ensure successful outcomes. Mishandling these crucial steps could result in inaccuracies, duplicate data, or malfunctioning dashboards, defeating the purpose of using Tableau.

Fetching Data
Fetching data means grabbing data from the database (e.g., Google Analytics) and making it ready to be viewed in Tableau. This process includes connecting Tableau to different data sources such as databases, spreadsheets, or cloud services, and importing the data into Tableau for analysis and visualization.
How you fetch data greatly influences the performance of your Tableau dashboard. It’s essential to decide whether data fetching will happen in real-time or in batches. For instance, if you’re getting data from a Shopify or Google Analytics API, you’ll need to establish a process for either real-time or batch fetching.
Moreover, the frequency of batch processing matters. This determines how often groups or batches of data are sent to the data warehouse. At PenPath, for example, we’ve set the frequency to 6 to 12 hours to fetch data from various platforms and ensure it reaches our data warehouse.
Furthermore, there are different methods to fetch data e.g. through API, e-mail, flat-file ingestion, etc. Each of them brings a unique set of challenges to the table.
API Access
APIs are one of the ways you can fetch your data. As you connect Google Ads, Twitter Ads, Instagram Ads, Google Analytics, etc. with Tableau, you will first have to obtain an API key, Access Token, or an OAuth 2.0 from each of these platforms. If you’re okay with technical stuff, this part won’t be hard.
The tricky part is handling the special limits for each API. Each API works differently. For example, depending on your API rights, you might be limited in how much data you can get. This could mean some data won’t show up on your dashboard.
Furthermore, you need to think about how many times you can call an API. This varies from one platform to another. Limits can include:
- Number of calls you can make to an API per minute
- Number of calls you can make to an API per user
- Number of rows it can push per minute
Tableau Can’t Fetch Directly from APIs
One big problem is that Tableau can’t directly get data from some APIs. Instead, it needs ETL (Extract, Transform, Load) data pipelines. These pipelines help Tableau fetch, save, and deal with raw data from platforms or services with APIs. Data pipelines are all about taking data from different platforms, changing it if needed, and then putting it into Tableau so people can analyze and understand it better.

You can still use API with Tableau but you have to do it via microservices, meaning having your own system in which you send and receive data independently. An example of a microservice would be a login function. A login microservice is responsible for handling the authentication process within a software system. When a user attempts to log in, the microservice validates the provided credentials, verifies the user’s identity by comparing encrypted passwords, generates an authentication token upon successful authentication, and sends the appropriate response back to the client application.
API Changes
Sometimes, APIs change, and this can mess up calculations and visuals in Tableau. These changes might mean renaming or removing columns. To fix this, professionals have to manually update the column names in Tableau. Tableau can’t do this automatically by itself, so if you keep using old or changed columns in your calculations, they won’t work right. Even if data still shows up in Tableau, any calculations using the missing columns will show errors and might break your Tableau dashboard.
Data Cleaning
Data is often messy when it’s first fetched. This necessitates a series of tasks to ensure its quality. The process includes:
- Looking at the data’s structure,
- Dealing with missing values by either replacing them or assigning NULL for no data,
- Making sure all the data follows the same rules for naming and formatting,
- Handling duplicate entries and outliers,
- Integrating and joining data from multiple sources,
- Creating calculated fields and transformations, and
- Validating the cleaned data for accuracy.
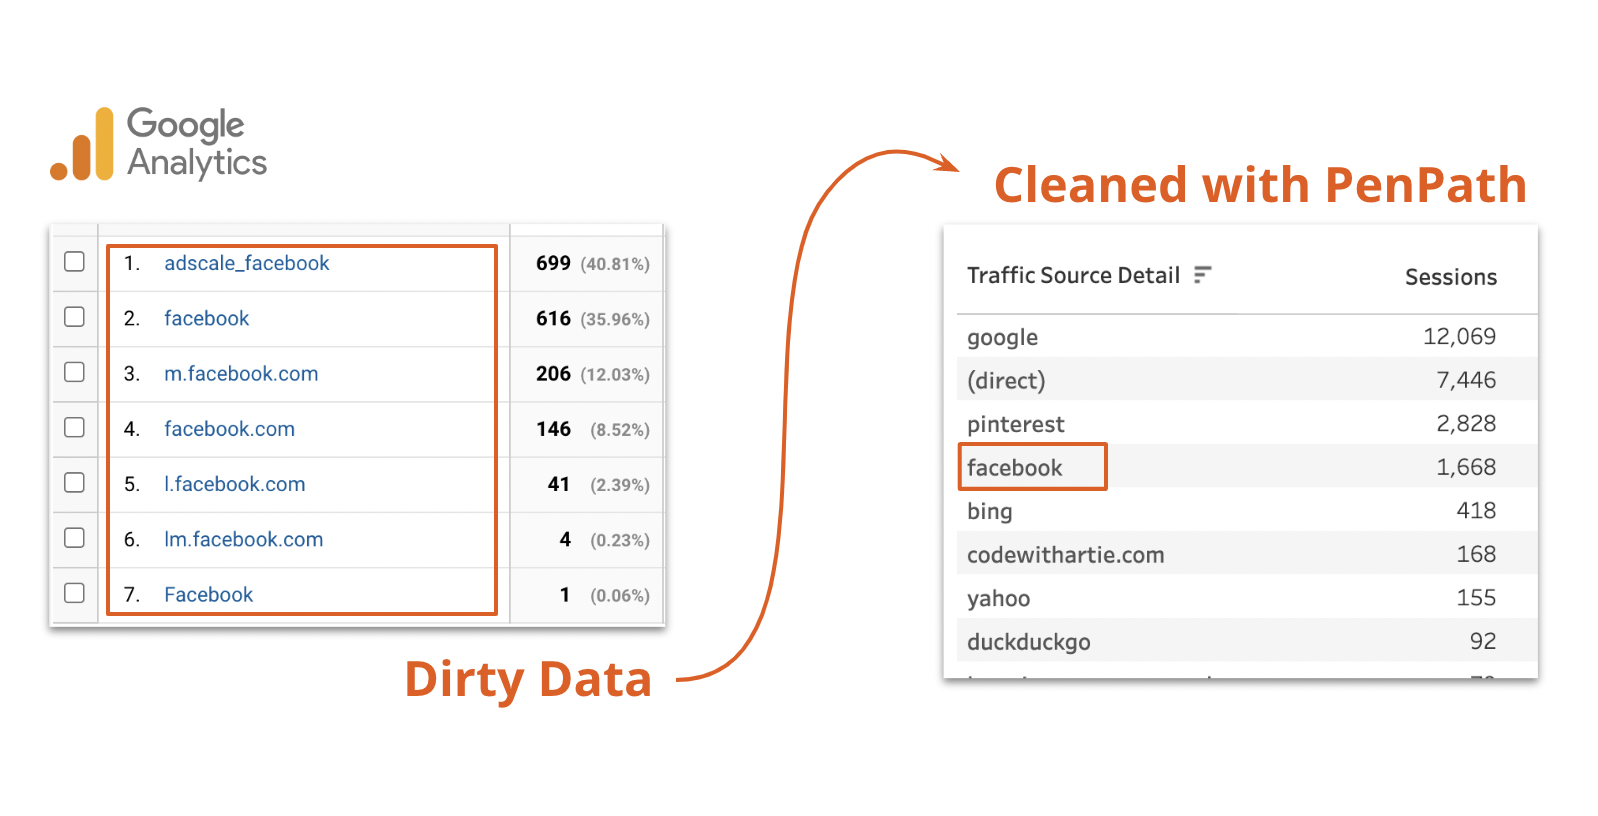
For example, if two pieces of data have the same order number, one might be flagged as a duplicate. In Google Analytics, we make sure the source and medium are labeled correctly. Also, in platforms like Shopify, we fix country and currency codes so they’re consistent. For instance, “US” and “USA” may originate from an API and both represent the United States of America, so we need to use both forms correctly in our dashboard.
Moreover, in batch processes, the same data may be pulled twice. Therefore, it is essential to eliminate duplicate metrics.
These types of data cleaning are necessary on all API endpoints. Even with paid media platforms like Facebook Ads and Google Ads, it’s crucial to tidy up and make sure all the campaign names are consistent.
Finally, remember that cleaning data isn’t a one-time job. It needs to be incorporated as a regular process to maintain data cleanliness. Data modeling and machine learning are performed on clean data, therefore to optimize things like predictive analytics, data cleaning should be done accurately and regularly.

Data Modeling
Data modeling means arranging data so it’s easy to analyze and understand visually. It is necessary for enriching data and maximizing its usability in a dashboard. Tableau is primarily known for its data visualization and analytics capabilities rather than advanced data modeling functionalities.
To perform advanced data modeling tasks or complex transformations, it’s better to use dedicated data modeling tools or get the data ready using ETL processes (Extract, Transform, Load) before connecting to Tableau for visualization and analysis purposes.
Change Data Capture
Setting up Change Data Capture (CDC) with Tableau also needs some effort. CDC is a technique used in data integration and warehousing to capture and track changes made to source data over time. It’s especially helpful with databases where data is always being added, changed, or removed.
CDC helps organizations stay updated on their data without having to reload or redo everything. This is great for real-time analysis because it makes data updates faster and more efficient.
Ready to unlock the full potential of Tableau for your e-commerce and marketing data analytics? PenPath’s all-in-one e-commerce and marketing data analytics software suite is built on top of Tableau. It offers a range of features designed to help brands increase sales and cut costs with data-informed decisions. Speak with one of our experts!


